[nextpage title=”Introduction”]
The Radeon HD 6570 and Radeon HD 6670 were originally released at the beginning of the year as OEM products, i.e. available only for computer manufacturers. Last week, AMD released them on the retail market, with a suggested price of USD 80 and USD 100, respectively.
The USD 100 price point of the Radeon HD 6670 puts it between the GeForce GT 440 (USD 70 to USD 80) and the GeForce GTS 450 (USD 115). Since the Radeon HD 6570 is the video card competing directly with the GeForce GT 440, we will be comparing the Radeon HD 6670 to the GeForce GTS 450. We also added a Radeon HD 5670 to our comparison. Even though this video card is, today, in a different price range (USD 70), it is always good to see the performance improvement obtained by a new graphics chip compared to its counterpart from the previous generation.
In the table below we compare the main specs of the video cards included in our review. They are all DirectX 11 parts. The prices listed below do not include rebates. Prices were researched at Newegg.com on the day we published this review.
| Video Card | Core Clock | Shader Clock | Memory Clock (Real) | Memory Clock (Effective) | Memory Interface | Memory Transfer Rate | Memory | Shaders | Price |
| GeForce GTS 450 | 783 MHz | 1,566 MHz | 1.8 GHz | 3.6 GHz | 128-bit | 57.7 GB/s | 1 GB GDDR5 | 192 | USD 115 |
| Radeon HD 6670 | 800 MHz | 800 MHz | 2 GHz | 4 GHz | 128-bit | 64 GB/s | 1 GB GDDR5 | 480 | USD 100 |
| Radeon HD 5670 | 775 MHz | 775 MHz | 2 GHz | 4 GHz | 128-bit | 64 GB/s | 512 MB GDDR5 | 400 | USD 70 |
You can compare the specs of these video cards with other video cards by taking a look at our AMD ATI Chips Comparison Table and NVIDIA Chips Comparison Table tutorials.
Now let’s take a complete look at the reference model of the Radeon HD 6670.
[nextpage title=”The AMD Radeon HD 6670″]
Below we have an overall look at the AMD reference model of the Radeon HD 6670. It doesn’t require any additional power connector and it is a low-profile video card, meaning that you can install it on a low-profile case by replacing its rear bracket.
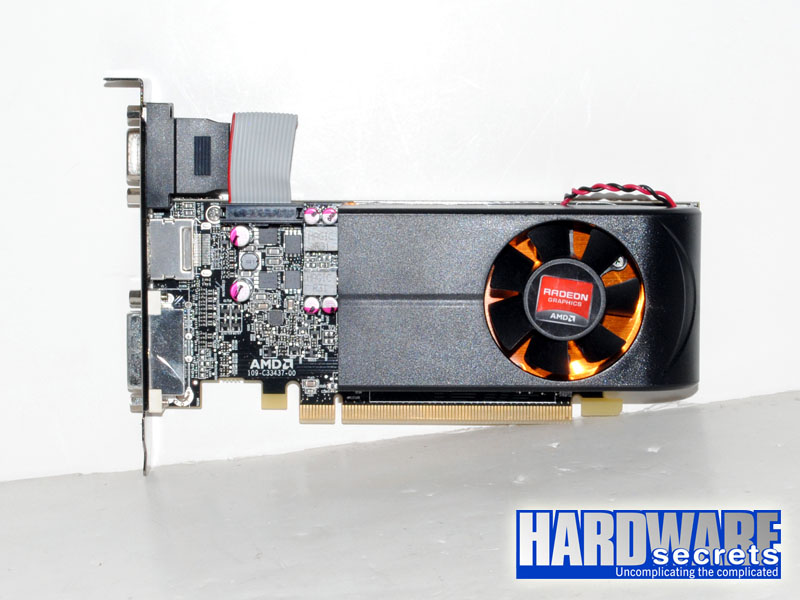 Figure 1: AMD Radeon HD 6670 reference model
 Figure 2: AMD Radeon HD 6670 reference model
This video card has one DVI-D, one HDMI, and one VGA connector.
 Figure 3: Video connectors
[nextpage title=”The AMD Radeon HD 6670 (Cont’d)”]
In Figure 4, you can see the video card with its cooler removed. It uses only solid capacitors and ferrite-core coils (which makes the regulator present higher efficiency because they present lower energy loss than iron-core coils). The voltage regulator circuit has two phases for the graphics chip and one phase for the memory chips.
 Figure 4: Video card with the cooler removed
The GPU heatsink can be seen in Figures 5 and 6. It has a copper base, aluminum fins, and a 45 mm fan.
 Figure 5: The GPU heatsink
 Figure 6: The GPU heatsink
The Radeon HD 6670 reference model uses four 2 Gbit GDDR5 memory chips, making its 1 GB memory (2 Gbit x 4 = 1 GB). The chips used are H5GQ2H24MFR-T2C parts from Hynix, which support up to 2.5 GHz (5 GHz DDR), and since on this video card memory is accessed at 2 GHz (4 GHz DDR), there is still a huge 25% margin for you to increase the memory clock rate while keeping the chips inside the maximum they support. Of course you can always try to overclock the memory chips above their specs.
 Figure 7: Memory chips
Before seeing the performance results, let’s recap the main features of this video card.
[nextpage title=”Main Features”]
The main features of the reference model of the Radeon HD 6670 video card include:
- Graphics chip: AMD Radeon HD 6670 running at 800 MHz
- Memory: 1 GB GDDR5 memory (128-bit interface) from Hynix (H5GQ2H24MFR-T2C), running at 2 GHz (4 GHz, QDR)
- Bus type: PCI Express x16 2.0
- Video Connectors: One DVI-D, one HDMI, and one VGA
- Video Capture (VIVO): No
- Cables and adapters that come with this board: NA
- Number of CDs/DVDs that come with this board: NA
- Games included: NA
- Programs included: NA
- More information: https://www.amd.com
- MSRP in the US: USD 100
[nextpage title=”How We Tested”]
During our benchmarking sessions, we used the configuration listed below. Between our benchmarking sessions the only variable was the video card being tested.
Hardware Configuration
- CPU: Core i3-2100 (3.1 GHz, 3 MB L2 memory cache)
- Motherboard: Intel DH67BL (0110 BIOS)
- Memories: Two 1 GB Crucial CT12864BA1339 modules (DDR3-1333/PC3-10600, CL9, 1.5 V), configured at 1333 MHz
- Hard disk drive: Western Digital Caviar Black 1 TB (WD1001FALS, SATA-300, 7200 rpm, 32 MB buffer)
- Video monitor: Samsung SyncMaster 305T (30” LCD, 2560×1600)
- Power Supply: OCZ StealthXStream 400 W
- CPU Cooler: Intel stock
Software Configuration
- Windows 7 Ultimate 64-bit
- Video resolution: 2560×1600 @ 60 Hz
Driver Versions
- AMD video driver version: Catalyst 11.3 (Radeon HD 5670)
- AMD video driver version: 8.84.2 (Radeon HD 6670)
- NVIDIA video driver version: 270.61
- Intel Inf driver version: 9.2.0.1030
Software Used
- 3DMark 11 Professional 1.0.1
- Aliens vs. Predator + Benchmark Tool
- Call of Duty 4 – Patch 1.7
- Crysis Warhead – Patch 1.1 + HOC Bench Crysis Warhead Benchmark Tool 1.1.1
- Far Cry 2 – Patch 1.03
- Lost Planet 2
- StarCraft II: Wings of Liberty – Patch 1.3.2
Error Margin
We adopted a 3% error margin. Thus, differences below 3% cannot be considered relevant. In other words, products with a performance difference below 3% should be considered as having similar performance.
[nextpage title=”Call of Duty 4″]
Call of Duty 4 is a DirectX 9 game implementing high-dynamic range (HDR) and its own physics engine, which is used to calculate how objects interact. For example, if you shoot, exactly what will happen to the object when the bullet hits it? Will it break? Will it move? Will the bullet bounce back? It gives a more realistic experience to the user.
To get accurate results, we had to disable the 80 FPS limit in the game. To do this, input the command, “/seta com max fps 1000” (minus the quotes) into the console (` key). It can be set to any number greater than 200.
We ran this program at two 16:10 widescreen resolutions, 1440×900 and 1680×1050, maxing out all image quality controls (i.e., everything was set to the maximum values in the Graphics and Texture menus). We used the internal game benchmarking feature, running a demo provided by NVIDIA called “wetwork.” We are putting this demo here for downloading if you want to run your own benchmarks. We ran the demo five times, and the results below are the average number of frames per second (FPS) achieved by each video card.

| Call of Duty 4 – Maximum | 1440×900 | Difference |
| GeForce GTS 450 | 84.6 | 14% |
| Radeon HD 6670 | 74.2 | |
| Radeon HD 5670 | 69.8 | 6% |

| Call of Duty 4 – Maximum | 1680×1050 | Difference |
| GeForce GTS 450 | 79.2 | 30% |
| Radeon HD 6670 | 60.8 | |
| Radeon HD 5670 | 55.9 | 9% |
[nextpage title=”StarCraft II: Wings of Liberty”]
StarCraft II: Wings of Liberty is a very popular DirectX 9 game that was released in 2010. Though this game uses an old version of DirectX, the number of textures that can be represented on one screen can push most of the top-end graphics cards to their limits (especially when the graphics settings are set at “ultra”). StarCraft II: Wings of Liberty uses its own physics engine that is bound to the CPU and thus does not benefit from PhysX.
We tested this game at 1440×900 and 1680×1050. The quality of the game was set to the “medium” preset, disabling both anti-aliasing and anisotropic filtering. We then used FRAPS to collect the frame rate of a replay on the “Unit Testing” custom map. We used a battle between very large armies to stress the video cards.

| StarCraft II: Wings of Liberty | 1440×900 | Difference |
| GeForce GTS 450 | 98.75 | 12% |
| Radeon HD 6670 | 88.52 | |
| Radeon HD 5670 | 83.56 | 6% |

| Starcraft II: Wings of Liberty | 1680×1050 | Difference |
| GeForce GTS 450 | 92.35 | 12% |
| Radeon HD 6670 | 82.69 | |
| Radeon HD 5670 | 75.49 | 10% |
[nextpage title=”Crysis Warhead”]
Crysis Warhead is a DirectX 10 game based on the same engine as the original Crysis, but optimized (it runs under DirectX 9.0c when installed on Windows XP).
We used the HardwareOC Crysis Warhead Benchmark Tool to collect the data for this test. We ran this program at 1440×900 and 1680×1050 at “high” image quality (but with no anti-aliasing and no anisotropic filtering) and using the Airfield demo. The results below are the number of frames per second achieved by each video card.

| Crysis Warhead | 1440×900 | Difference |
| GeForce GTS 450 | 34.8 | 11% |
| Radeon HD 6670 | 31.4 | |
| Radeon HD 5670 | 28.6 | 10% |

< td>22.6
| Crysis Warhead | 1680×1050 | Difference |
| GeForce GTS 450 | 27.3 | 11% |
| Radeon HD 6670 | 24.6 | |
| Radeon HD 5670 | 9% |
[nextpage title=”Far Cry 2″]
Far Cry 2 is based on an entirely new game engine called Dunia, which is DirectX 10 when played under Windows Vista with a DirectX 10 compatible video card.
We used the benchmarking utility that comes with this game at 1440×900 and 1680×1050, setting image quality to “high” (with no anti-aliasing) and running the “Ranch Long” demo three times. The results below are expressed in frames per second and are an arithmetic average of the three results collected.

| Farcry 2 | 1440×900 | Difference |
| GeForce GTS 450 | 97.63 | 33% |
| Radeon HD 6670 | 73.49 | |
| Radeon HD 5670 | 65.42 | 12% |

| Farcry 2 | 1680×1050 | Difference |
| GeForce GTS 450 | 86.44 | 40% |
| Radeon HD 6670 | 61.72 | |
| Radeon HD 5670 | 54.38 | 13% |
[nextpage title=”Aliens vs. Predator”]
Aliens vs. Predator is a DirectX 11 game that makes full use of tessellation and advanced shadow rendering. We used the Aliens vs. Predator Benchmark Tool developed by Rebellion. This program reads its configuration from a text file (our configuration files can be found here). We ran this program at 1440×900 and 1680×1050, with texture set at “low,” shadows set at “low,” no anisotropic filtering and no anti-aliasing.

| Aliens vs. Predator | 1440×900 | Difference |
| GeForce GTS 450 |
35.7 |
7% |
| Radeon HD 6670 | 33.3 | |
| Radeon HD 5670 | 30.0 | 11% |

| Aliens vs. Predator | 1680×1050 | Difference |
| GeForce GTS 450 |
27.7 |
7% |
| Radeon HD 6670 | 25.8 | |
| Radeon HD 5670 |
23.1 |
12% |
[nextpage title=”Lost Planet 2″]
Lost Planet 2 is a game that uses a lot of DirectX 11 features, like tessellation (to round out the edges of polygonal models), displacement maps (added to the tessellated mesh to add fine grain details), DirectCompute soft body simulation (to introduce more realism in the “boss” monsters), and DirectCompute wave simulation (to introduce more realism in the physics calculations in water surfaces; when you move or when gunshots and explosions hit the water, it moves accordingly). We reviewed the video cards using Lost Planet 2 internal benchmarking features, choosing the “Benchmark A” (we know that “Benchmark B” is the one recommended for reviewing video cards, however, at least with us, results were inconsistent). We set graphics at “medium,” no anti-aliasing and DX11 at “full,” at 1440×900 and 1680×1050. The results below are the number of frames per second generated by each video card.

| Lost Planet 2 | 1440×900 | Difference |
| GeForce GTS 450 | 38.6 | 5% |
| Radeon HD 6670 | 36.6 | |
| Radeon HD 5670 | 33.6 | 9% |

| Lost Planet 2 | 1680×1050 | Difference |
| GeForce GTS 450 | 38.6 | 29% |
| Radeon HD 6670 | 30.0 | |
| Radeon HD 5670 | 25.2 | 19% |
[nextpage title=”3DMark 11 Professional”]
3DMark 11 Professional measures Shader 5.0 (i.e., DirectX 11) performance. We ran this program at 1440×900 and 1680×1050, selecting the four graphics tests available and deselecting the other tests available. We used two image quality settings, “performance” and “extreme,” both at their default settings. The results being compared are the “GPU Score” achieved by each video card.

| 3DMark Vantage – Entry | 1440×900 | Difference |
| GeForce GTS 450 |
1862 |
16% |
| Radeon HD 6670 |
1602 |
|
| Radeon HD 5670 |
1451 |
10% |


| 3DMark Vantage – Entry | 1680×1050 | Difference |
| GeForce GTS 450 |
1504 |
14% |
| Radeon HD 6670 |
1317 |
|
| Radeon HD 5670 |
1174 |
12% |
| 3DMark 11 – Performance | 1440×900 | Difference |
| GeForce GTS 450 |
1562 |
15% |
| Radeon HD 6670 |
1353 |
|
| Radeon HD 5670 | 1218 | 11% |

| 3DMark 11 – Performance | 1680×1050 | Difference |
| GeForce GTS 450 |
1247 |
13% |
| Radeon HD 6670 |
1100 |
|
| Radeon HD 5670 | 987 | 11% |
[nextpage title=”Conclusions”]
The GeForce GTS 450 was between 5% and 40% faster than the Radeon HD 6670 in our benchmarking. So, between the two, the GTS 450 is the video card we recommend. Some may think the comparison is a little bit unfair, since the GeForce GTS 450 is USD 15 more expensive than the Radeon HD 6670. However, with this 15% difference in price, you get up to 40% higher performance, and, therefore, the extra money spells money well-spent in our book.
Leave a Reply