[nextpage title=”Introduction”]
Following up the launch of CPUs with an integrated video controller for laptops two weeks ago, codenamed “Llano,” AMD is finally launching their much anticipated CPU series for desktops with an integrated video controller. Let’s check the performance of the new A8-3850 and how it stacks up against its main competitor, Intel’s Core i3-2100.
AMD calls their CPUs with integrated video controller “APUs” (Accelerated Processing Units). In our articles and reviews, we will still be calling these products “CPUs.”
AMD first announced that they would be creating a CPU with an integrated graphics chip in 2006, and gave the name “Fusion” to this idea. Intel, however, copied this idea and released CPUs with integrated video controllers in the beginning of 2010, within its Core i series.
Because AMD took five years to release their first series of desktop CPUs with an integrated graphics controller, this is one of the most anticipated releases in the PC hardware industry.
The new A-Series CPUs come with a new set of codenames. Both desktop and mobile versions are called internally “Llano” by AMD, with the mobile platform called “Sabine,” and the desktop platform called “Lynx.” The CPU cores are codenamed “Stars,” and are manufactured using the 32 nm manufacturing process.
The main feature of the A-Series CPUs is, as you might expect, the new integrated graphics chip. Two versions of this graphics chip are being released, and more versions will be available in the future. The A8 CPUs use a Radeon HD 6550D integrated graphics engine, while A6 CPUs use a Radeon HD 6530D graphics engine. The main specifications for these engines are listed in Figure 1. They are DirectX 11 parts, which is certainly an advantage over Intel products, which are still based on DirectX 10.1.
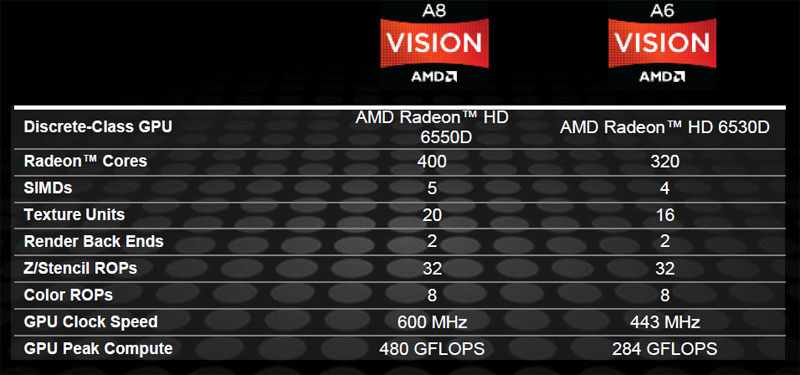 Figure 1: Overview of the graphics engines
If you install a discrete video card on your system, it may be able to work together with the CPU integrated graphics in a CrossFireX configuration, improving the 3D video performance. This configuration, called “Dual Graphics,” is currently supported only by Radeon HD 6350, 6450, 6570, and 6670. It is very interesting to note the naming system AMD is going to use. When you have a CPU with an integrated Radeon HD 6550D and install a Radeon HD 6670, your system is said to have a “Radeon HD 6690D2” installed. See Figure 2.
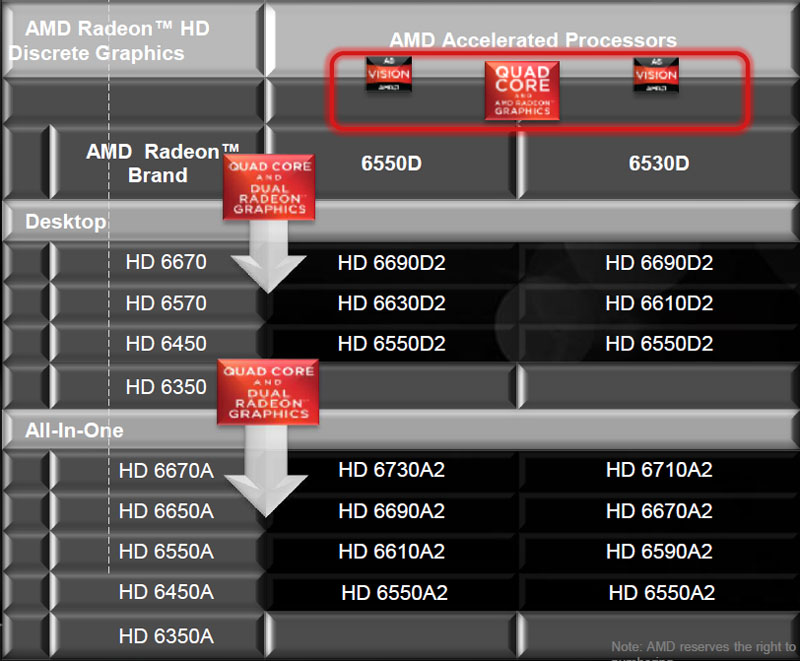 Figure 2: Dual Graphics configuration
Both graphics engines also have hardware-based 2D video enhancements in a package called UVD3 (Unified Video Decoder 3). See Figure 3. With this package, video enhancements listed in Figure 3 are processed automatically by the video engine, improving the quality of video playback. Also, the video engine supports hadware-based 3D Blu-Ray, H.264, VC-1, MPEG2, WMV, DivX, MVC, and Adobe Flash decoding, improving performance when you play videos compressed in any of these formats.
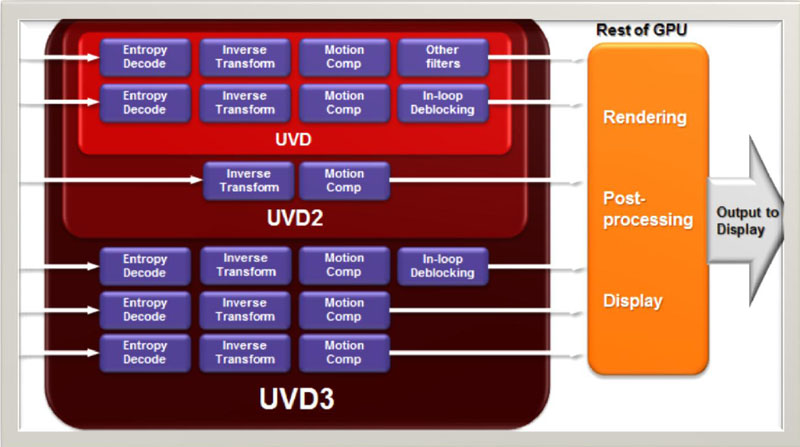 Figure 3: 2D video enhancements supported (UVD3)
[nextpage title=”More Features”]
A-Series CPUs, like all AMD CPUs since the Athlon 64, have an integrated memory controller. This controller supports dual-channel memory architecture, but what is new is the official support for DDR3 memories up to 1,866 MHz at 1.5 V. (In our review, however, we used DDR3-1333 parts.)
All models have an L1 memory cache of 128 KB (64 KB for instructions and 64 KB for data) per core and an L2 memory cache of 1 MB per core.
Not all A-Series CPUs will support AMD’s Turbo Core technology, which is the equivalent of Intel’s Turbo Boost. This technology allows the CPU to increase its clock rate if applications are demanding more processing power. In the A-Series line-up, the models ending with “50” don’t have this feature, which is the case of the model we are reviewing.
A new feature for AMD processors is the addition of a PCI Express 2.0 controller inside the CPU. This controller is capable of accessing one PCI Express x16 slot running at x16 speed or two PCI Express x16 slots running at x8 each. In addition, it has four x1 general-purpose PCI Express lanes, which can be used to drive PCI Express x1 slots or other on-board components. More PCI Express lanes are available on the chipset. The current chipsets available for this platform, the A55 and the A75, support four x1 PCI Express lanes.
Speaking of chipsets, AMD is releasing two chipsets for this new platform, the A55 and the A75. Both are single-chip solutions. The A55 is an entry-level solution, supporting six SATA-300 ports, 14 USB 2.0 ports, and the four x1 PCI Express lanes already mentioned. The A75 is a high-end solution, with six SATA-600 ports, four USB 3.0 ports (making it the first chipset with an integrated USB 3.0 controller), eSATA port multiplier (“FIS-based switching,” which allows you to install more than one hard drive to a single SATA port; click here to understand more) and the other features found on the A55.
 Figure 4: A55 block diagram
 Figure 5: A75 block diagram
The new A-Series CPUs are based on a new 905-pin socket, called FM1. (You will see this socket being referred to as having 937 pins, but this information is incorrect.) In Figure 6, you can see how this new socket looks. It supports the same CPU coolers as sockets AM2, AM2+, AM3, AM3+, etc.
 Figure 6: Socket FM1
[nextpage title=”The Reviewed CPUs”]
In the tables below, we compare the main features of the A8-3850 with those of its main competitor, the Core i3-2100. The Core i3-2100 supports the SSE4 instruction set (both SSE4.1 and SSE4.2), which is not available on the A8-3850. The Core i3-2100 is a dual-core CPU, but since it supports Hyper-Threading (HT) technology, which simulates one additional core per CPU physical core, the operating system “sees” this CPU as having four cores.
| CPU | Cores | HT | SSE4 | IGP | Internal Clock | Turbo Clock | Base Clock | Core | Technology | TDP | Socket | Price |
| Core i3-2100 | 2 | Yes | Yes | Yes | 3.1 GHz | No | 100 MHz | Sandy Bridge | 32 nm | 65 W | 1155 | USD 125 |
| A8-3850 | 4 | No | No | Yes | 2.9 GHz | No | 100 MHz | Stars | 32 nm | 100 W | FM1 | USD 135 |
TDP stands for Thermal Design Power which advises the user of the maximum amount of heat the CPU can dissipate. The CPU cooler must be capable of dissipating at least this amount of heat. The A-Series CPUs ending at “00” have a lower TDP (65 W).
| CPU | L1 Cache | L2 Cache | L3 Cache | Memory Support | Memory Channels |
| Core i3-2100 | 32 KB + 32 KB per core | 256 kB per core | 3 MB total | Up to DDR3-1333 | Two |
| A8-3850 | 64 KB + 64 KB per core | 1 MB per core | No | Up to DDR3-1866 | Two |
Below we have a quick comparison of the video engine of the two CPUs.
| CPU | DirectX | Clock | Cores |
| Core i3-2100 | 10.1 | 850 MHz | 6 |
| A8-3850 | 11 | 600 MHz | 400 |
Below, you can see the two reviewed CPUs.
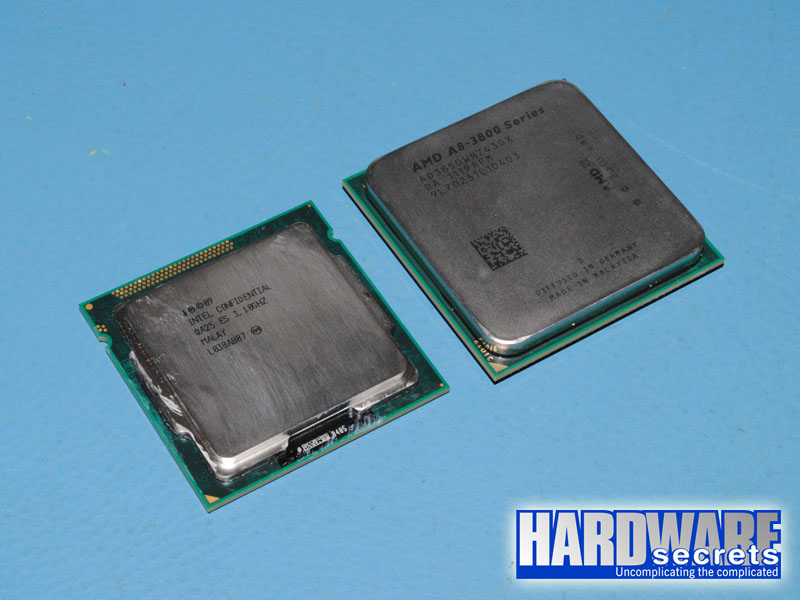 Figure 7: Reviewed CPUs
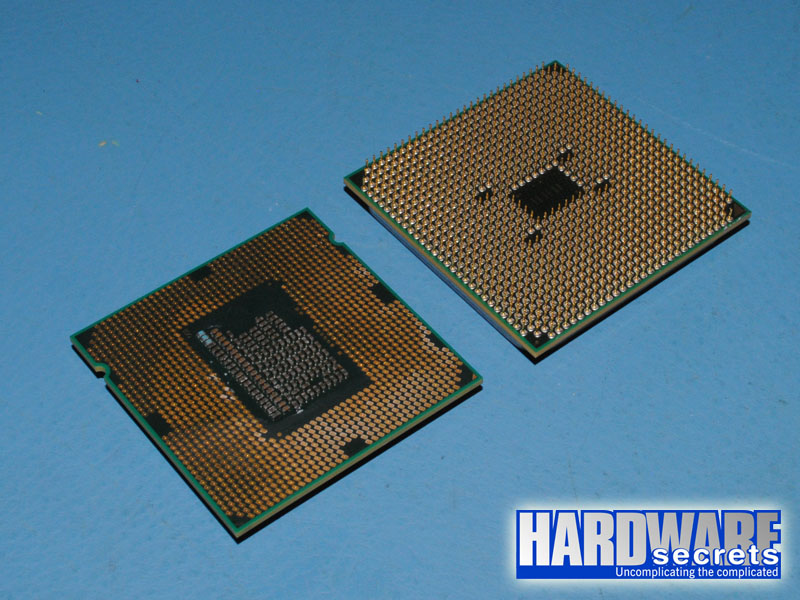 Figure 8: Reviewed CPUs
[nextpage title=”How We Tested”]
During our benchmarking sessions, we used the configuration listed below. Between our benchmarking sessions, the only variable device was the CPU being tested and the motherboard, which had to be replaced to match the different CPU sockets.
Hardware Configuration
- Motherboard (Socket FM1): Gigabyte GA-A75M-UD2H (F2 BIOS)
- Motherboard (Socket LGA1155): Intel DH67BL (1050 BIOS)
- CPU Cooler: Intel/AMD stock
- Memory: 4 GB DDR3-1333, two G.Skill F3-10666CL7T memory modules
- Hard Disk Drive: Western Digital Black Caviar 1 TB (WD1001FALS, SATA-300, 7,200 rpm, 32 MB buffer)
- Video Card: GeForce GT 430 (used on some tests only)
- Video Monitor: Samsung Syncmaster 932BW
- Power Supply: OCZ StealthXStream 400 W
Operating System Configuration
- Windows 7 Ultimate 64-bit
- NTFS
- Video resolution: 1440×90 60 Hz
Driver Versions
- AMD video driver version: 8.86 RC2
- AMD chipset driver version: 8.862
- Intel video driver version: 15.21.12.2321
- Intel Inf chipset driver version: 9.2.0.1025
- NVIDIA video driver version: 275.33
Software Used
- PCMark 7 1.0.4
- VirtualDub 1.9.5 + MPEG-2 Plugin 3.1 + DivX 6.9.2
- Adobe Photoshop CS4 Extended + GamingHeaven Photoshop Benchmark V3
- Adobe After Effects CS4
- Media Espresso 6.5
- WinZip 15.5
- iTunes 10.2
- Cinebench 11.529
- Call of Duty 4 – Patch 1.7
- Starcraft II: Wings of Liberty – Patch 1.3.4
- Far Cry 2 – Patch 1.03
- Lost Planet 2
- 3DMark 11 1.0.1
Error Margin
We adopted a 3% error margin. Thus differences below 3% cannot be considered relevant. In other words, products with a performance difference below 3% should be considered as having similar performance.
[nextpage title=”PCMark 7″]
The new PCMark 7 performs a series of tests and gives scores in the following categories: An overall score called PCMark; a Productivity score, which is the system performance when using applications such as web browsing and home office applications; a Creativity score, which is the system performance when viewing, editing, converting, and storing photos and videos; an Entertainment score, which is the system performance when recording, viewing, streaming, and converting TV shows and movies, importing, organizing, and browsing music, and gaming; and a Computation score, which indicates the processing performance of the system. Let’s analyze the results.

The Core i3-2100 achieved an overall score 9% higher than the one achieved by the A8-3850.

The Core i3-2100 achieved a Productivity score 8% higher than the one achieved by the A8-3850.

The Core i3-2100 achieved a Creativity score 6% higher than the one achieved by the A8-3850.

On the Entertainment tests, the A8-3850 achieved a score 7% higher than the Core i3-2100’s.

The Core i3-2100 achieved a Computation score 9% higher than the one achieved by the A8-3850.
[nextpage title=”VirtualDub”]
With VirtualDub, we converted a full-length DVD movie to DivX format and saw how long it took for this conversion to be completed. DivX codec is capable of recognizing and using not only more than one CPU (i.e., more than one core) but also the SSE4 instruction set.
The movie we chose to convert was “Star Trek – The Motion Picture: Director’s Cut.” We copied the movie to our hard disk drive with no compression, so the final original file on our HDD was 6.79 GB. After compressing it with DivX, the final file was only 767.40 MB, which is quite remarkable.
The results below are given in seconds, so the lower the better.

On DivX encoding, both CPUs achieved the same performance level.
[nextpage title=”Photoshop CS4″]
The best way to measure performance is by using real programs. The problem, though, is creating a methodology using real software that provides accurate results. For Photoshop CS4, there is a methodology created by the folks at GamingHeaven that is very accurate. Their script applies a series of 15 filters to a sample image, and we wrote down the time taken for each filter to run. At the end, we had the results for each individual filter, and we simply added them up to have the total time taken to run the 15 filters from the GamingHeaven batch. The results below are given in seconds, so the lower the number the better.

On Photoshop CS4, the Core i3-2100 was 28% faster than the A8-3850.
[nextpage title=”After Effects CS4″]
After Effects is very well-known program for video post-production that is used to add animation and visual effects in videos. To evaluate the performance of each CPU running this program, we ran a workload consisting of a number of compositions that applied several filters and effects to a variety of input file types such as PSD (Photoshop), AI (Illustrator), EPS and TIF. After each filter was applied, the composition was rendered to an uncompressed AVI file with the same resolution as the input files. The results below are the time each CPU took to finish the whole batch, given in seconds, so the lower the number the better.

On After Effects CS4, the Core i3-2100 was, again, the fastest CPU, being 19% faster than the A8-3850.
[nextpage title=”Media Espresso 6.5″]
Media Espresso is a video conversion program that uses the graphics processing unit of the video card to speed up the conversion process. It is also capable of using Intel’s QuickSync technology available in the CPUs from this company. We converted a 449 MB, 1920x1080i, 18884 kbps, MPG2 video file to a smaller 640×360, H.264, .MP4 file for viewing on a portable device such as an iPhone or iPod Touch.

Since Media Espresso is capable of using the video card GPU to speed up the conversion process, we also installed a GeForce GT 430 to see the performance we would have achieved if the CPU didn’t have an integrated graphics processor, and we were using a mainstream video card.
Here the Core i3-2100 was 36% faster than the A8-3850.
Using the integrated GPU of the A8-3850 CPU made our conversion process to be 16% faster than a GeForce GT 430, which is great.
The integrated GPU of the Core i3-2100 was 51% faster than a GeForce GT 430. In fact, the Core i3-2100 was 13% faster than a GeForce GTX 580, thanks to the Intel QuickSync technology.
[nextpage title=”WinZip”]
We used WinZip not only to measure compression time, but also decryption time. We measured the time each CPU took to decompress and decrypt 200 JPEG images, 125 of them at 10 megapixels and 75 of them at six megapixels. The total size of all the photos was around 830 MB. The results below are given in seconds, so the lower the number the better.

Decompressing and decrypting files, the Core i3-2100 was 21% faster than the A8-3850.
[nextpage title=”iTunes”]
We used iTunes to convert an uncompressed .wav file into a high-quality (160 Kbps) MP3 file, and checked how many seconds each CPU took to perform this operation. Therefore, the results below are given in seconds, so the lower the number the better.

Here the Core i3-2100 was, again, the fastest CPU, being 16% faster than the A8-3850.
[nextpage title=”Cinebench 11.5″]
Cinebench 11.5 is based on the 3D software Cinema 4d. It is very useful to measure the performance gain given by having more than one CPU installed on the system when rendering heavy 3D images. Rendering is one area in which having more than one CPU helps considerably, because usually, rendering software recognizes several CPUs. (Cinebench, for instance, can use up to 16 CPUs.)
Since we were interested in measuring the rendering performance, we ran the test called “Rendering x CPUs,” which renders a “heavy” sample image using all available CPUs (or cores – either real or virtual, as on CPUs with Hyper-Threading technology, each core is recognized as two cores by the operating system) to speed up the process.

Since the A8-3850 is a quad-core CPU, and the Core i3-2100 is a dual-core CPU, it achieved a score 13% higher on this program.
[nextpage title=”Call of Duty 4″]
Call of Duty 4 is a DirectX 9 game implementing high-dynamic range (HDR) and its own physics engine. We ran this game at 1440×900 with all image quality settings at their maximum values. We used t
he game internal benchmarking feature, running a demo provided by NVIDIA called wetwork. We are putting this demo for downloading here if you want to run your own benchmarking. The game was updated to version 1.7. We ran this test five times, discarding the lowest and the highest scores. The results below are an arithmetic average of the three remaining values, given in frames per second (FPS).
We ran this game twice with each CPU. First, we used the CPU integrated graphics. Then we added a GeForce GT 430 video card, which is an entry-level DirectX 11 video card.

The integrated graphics processor of the A8-3850 was 38% faster than the one from the Core i3-2100. A GeForce GT 430 proved to be 30% faster than the integrated graphics of the A8-3850 on this game, while the same video card proved to be 71% faster than the integrated video of the Core i3-2100.
[nextpage title=”StarCraft II: Wings of Liberty”]
StarCraft II: Wings of Liberty is a very popular DirectX 9 game that was released in 2010. Though this game uses an old version of DirectX, the number of textures that can be represented on one screen can push most of the top-end graphics cards to their limits (especially when the graphics settings are set at “Ultra”). StarCraft II: Wings of Liberty uses its own physics engine that is bound to the CPU and thus does not benefit from PhysX.
We tested this game at 1440×900. The quality of the game was set to the “high” preset, disabling both anti-aliasing and anisotropic filtering. We then used FRAPS to collect the frame rate of a replay on the “Unit Testing” custom map. We used a battle between very large armies to stress the video cards.

Here the integrated graphics processor of the A8-3850 was 66% faster than Core i3-2100’s. In fact, the performance achieved by the new AMD CPU will allow you to play this game at the published settings at a very good performance.
A GeForce GT 430 proved to be 24% faster than the integrated video of the A8-3850. The same video card was 112% faster than the integrated video of the Core i3-2100.
[nextpage title=”Far Cry 2″]
Far Cry 2 is based on an entire new game engine called Dunia, which is based on DirectX 10 when played under Windows 7 or Windows Vista with a DirectX 10-compatible video card. We used the benchmarking utility that comes with this game, setting video resolution to 1440 x 900, overall image quality to “high” (this is the lowest possible setting if you want to run this game at DirectX 10), setting all “Performance” options to “low,” disabling both anti-aliasing and anisotropic filtering, and running the demo “Ranch Long.” The results below are expressed in frames per second.

Here the A8-3850 was 30% faster than the Core i3-2100. A GeForce GT 430 was 53% faster than the integrated video of the A8-3850, and 104% faster than the integrated video of the Core i3-2100.
[nextpage title=”Lost Planet 2″]
Lost Planet 2 is a game that uses a lot of DirectX 11 features, like tessellation (to round out the edges of polygonal models), displacement maps (added to the tessellated mesh to add fine grain details), DirectCompute soft body simulation (to introduce more realism in the “boss” monsters), and DirectCompute wave simulation (to introduce more realism in the physics calculations in water surfaces; when you move or when gunshots and explosions hit the water, it moves accordingly). We reviewed the video cards using Lost Planet 2 internal benchmarking features, choosing the “Benchmark A” (we know that “Benchmark B” is the one recommended for reviewing video cards, however, at least with us, results were inconsistent). We ran this game at 1440×900 with graphics set at “medium,” with no anti-aliasing and no anisotropic filtering. The results below are the number of frames per second generated by each system.
Since the integrated graphics engine of the Core i3-2100 isn’t DirectX 11, we had to run this game in DirectX 9 mode with this CPU.

The A8-3850 was 45% faster than the Core i3-2100 in this game. Also, keep in mind that the A8-3850 ran this game in DirectX 11 mode, while the Core i3-2100 can only run this game in DirectX 9 mode.
The integrated video of the A8-3850 was 13% faster than a GeForce GT 430, probably indicating that the graphics engine of the A8-3850 is optimized for DirectX 11 games.
[nextpage title=”3DMark 11 Professional”]
3DMark 11 measures Shader 5.0 (i.e., DirectX 11) performance. Since the integrated graphics engine of the Core i3-2100 CPU is not DirectX 11, the only way to run this game was by installing an add-on video card. We used a GeForce GT 430 video card, which is an entry-level DirectX 11 video card. We ran this program at 1440×900 using the “Performance” profile.
This program provides three different scores: graphics, physics and combined.

A GeForce GT 430 achieved a graphics performance 18% higher than the A8-3850. The Core i3-2100 with a GeForce GT 430 installed achieved a performance 4% higher than the A8-3850 with the same video card installed.

The physics score measures exclusively the physics performance of the system. Here the A8-3850 achieved the same performance level as a GeForce GT 430. The Core i3-2100 with a GeForce GT 430 installed was 6% faster than the A8-3850 with the same video card installed.

The combined score shows a balance between the graphics and the physics performance achieved by each system being tested. Here, a GeForce GT 430 was 32% faster than the integrated video of the A8-3850. A Core i3-2100 with a GeForce GT 430 installed achieved the same performance level as an A8-3850 with the same video card installed.
[nextpage title=”Overclocking”]Overclocking the A8-3850 is very difficult, at least with the mothe
rboard we had available (Gigabyte GA-A75M-UD2H). This is because all clocks on the system (integrated memory controller, PCI Express lanes, SATA ports, graphics controller, memory, etc.) are tied to the CPU base clock. The default CPU base clock is 100 MHz, and the maximum we could go was only 107 MHz, making the CPU run internally at 3.1 GHz. Above that, the system would crash or would stop recognizing the hard drive. We believe that other motherboard models may allow the configuration of each separate clock, as we got reports from other editors of being able to increase the base clock up to 133 MHz, and some even above that. So, if you are into overclocking, you should carefully pick the motherboard to go with your AMD A-Series CPU.[nextpage title=”Conclusions”]
There is good news and bad news about the new A-Series CPU from AMD we reviewed, the A8-3850.
The good news is that its integrated graphics controller is simply the best integrated solution we’ve seen so far. It was way faster than the Core i3-2100’s and, on Lost Planet 2, it was even faster than a GeForce GT 430, making us suspect that it is optimized for DirectX 11 games. It was also faster than a GeForce GT 430 for applications that use the GPU for processing (GPGPU), such as converting video files using Media Espresso.
Also on the good side, applications that perform better with four “real” cores will perform better on the A8-3850 than on the Core i3-2100, which has only two “real” cores and two “simulated” ones, using Hyper-Threading technology.
The bad news is that, aside from gaming and 3D rendering, the Core i3-2100 is faster and, depending on the application, by a large margin.
So, if you are a gamer on a really tight budget, the new A8-3850 is a really nice option. But if you are an average user who won’t play games, the Core i3-2100 is a better option.
Leave a Reply